
Published: July 2025
The modern application monitoring landscape has become increasingly complex, with engineering teams spending countless hours configuring dashboards, setting up alerts, and wrestling with query languages just to get basic visibility into their applications. While solutions like Datadog, New Relic, and Grafana offer powerful capabilities, they often come with steep learning curves and significant setup overhead that can take days or weeks to implement effectively.
At Convox, we've taken a fundamentally different approach with our Metrics and Alerting platform. Instead of forcing teams to become monitoring experts, we've built Smart Panels and Smart Queries that provide instant, actionable insights with minimal configuration. This blog post explores how this approach compares to traditional monitoring solutions and demonstrates the real-world benefits of intelligent, pre-configured monitoring.
The Configuration Complexity Crisis
The Hidden Costs of Manual Setup
According to industry research, configuring comprehensive monitoring dashboards can take engineering teams anywhere from several days to weeks, depending on the complexity of their infrastructure. This time investment includes:
- Learning curve overhead: Teams need specialized knowledge to set up exporters, design dashboards, and configure alerting rules
- Query language mastery: Writing effective PromQL, NRQL, or custom queries requires significant expertise
- Dashboard design: Creating meaningful visualizations that provide actionable insights
- Alert tuning: Configuring thresholds that minimize false positives while catching real issues
The Monitoring Tool Landscape
The current market offers several approaches to application monitoring:
Enterprise Solutions (Datadog, New Relic)
- Datadog offers more than 750 integrations with different platforms and tools
- New Relic offers a generous free tier with 100GB of data and one full platform user
- Complex pricing models with Datadog's decentralized pricing where each product has its own pricing logic
Open Source Solutions (Prometheus + Grafana)
- Requires manual setup and maintenance, with teams needing to install and configure components, set up exporters, and design dashboards
- Flexibility comes at the cost of time and expertise
- Known as the de facto standard for metrics monitoring, especially in Kubernetes environments
Cost Comparison: The True Price of Monitoring
Traditional Platform Costs
Based on our research of industry pricing, here's how costs stack up for different deployment sizes:
Small Deployment (3 nodes, 500 metrics, 60s scrape):
- Convox: $0 (within free tier)
- Datadog: $54 per month
- AWS AMP: $5.90 per month
- Grafana Cloud: $12 per month
Medium Deployment (10 nodes, 1K metrics, 30s scrape):
- Convox: $38.20 per month
- Datadog: $180 per month
- AWS AMP: $78.80 per month
- Grafana Cloud: $160 per month
Large Deployment (100 nodes, 10K metrics, 30s scrape):
- Convox: $458.30 per month
- Datadog: $1,800 per month
- AWS AMP: $785.10 per month
- Grafana Cloud: $1,600 per month
Convox Metrics: Transparent, Usage-Based Pricing
Our metrics pricing is designed to be straightforward and cost-effective:
- Ingestion: $0.0025 per MB (first 250MB free)
- Queries: $0.25 per 1,000 queries (first 25,000 free)
- Storage: $0.025 per GB-month (5GB free)
For a medium-sized deployment, Convox Metrics costs $38.20 per month compared to $180 for Datadog, $160 for Grafana Cloud, and $78.80 for AWS AMP – delivering cost savings of 79% to 88% while providing superior ease of use.
Smart Panels: Intelligence Built In
Pre-Configured Insights
Unlike traditional monitoring platforms that require manual dashboard creation, Convox automatically generates essential monitoring panels when you enable metrics:
- Rack CPU Usage: Real-time CPU utilization across your infrastructure
- Rack Memory Usage: Memory consumption patterns and trends
- Rack Network I/O: Network throughput and activity monitoring
- Rack Network Errors: Network error rates and patterns
- Application Pod Count: Number of running application instances
- Application Pod Ready %: Health percentage of application pods
These panels provide immediate value without requiring any configuration or query writing.
Smart Queries: Monitoring Made Accessible
Our Smart Query system eliminates the need to learn complex query languages. Instead of writing PromQL or NRQL, users can:
- Select their rack from a simple dropdown
- Choose applications (all or specific ones)
- Select services (all or specific ones)
- Pick metrics from our curated Smart Query list
- Generate previews instantly
Available Smart Query metrics include:
- CPU Usage Trend
- Memory Usage Trend
- Network I/O patterns
- Request rates and response times
This approach reduces the typical dashboard creation time from hours or days to minutes.
Real-World Impact: Setup Time Comparison
Traditional Monitoring Setup
Based on industry documentation and best practices, here's the typical timeline for setting up comprehensive monitoring:
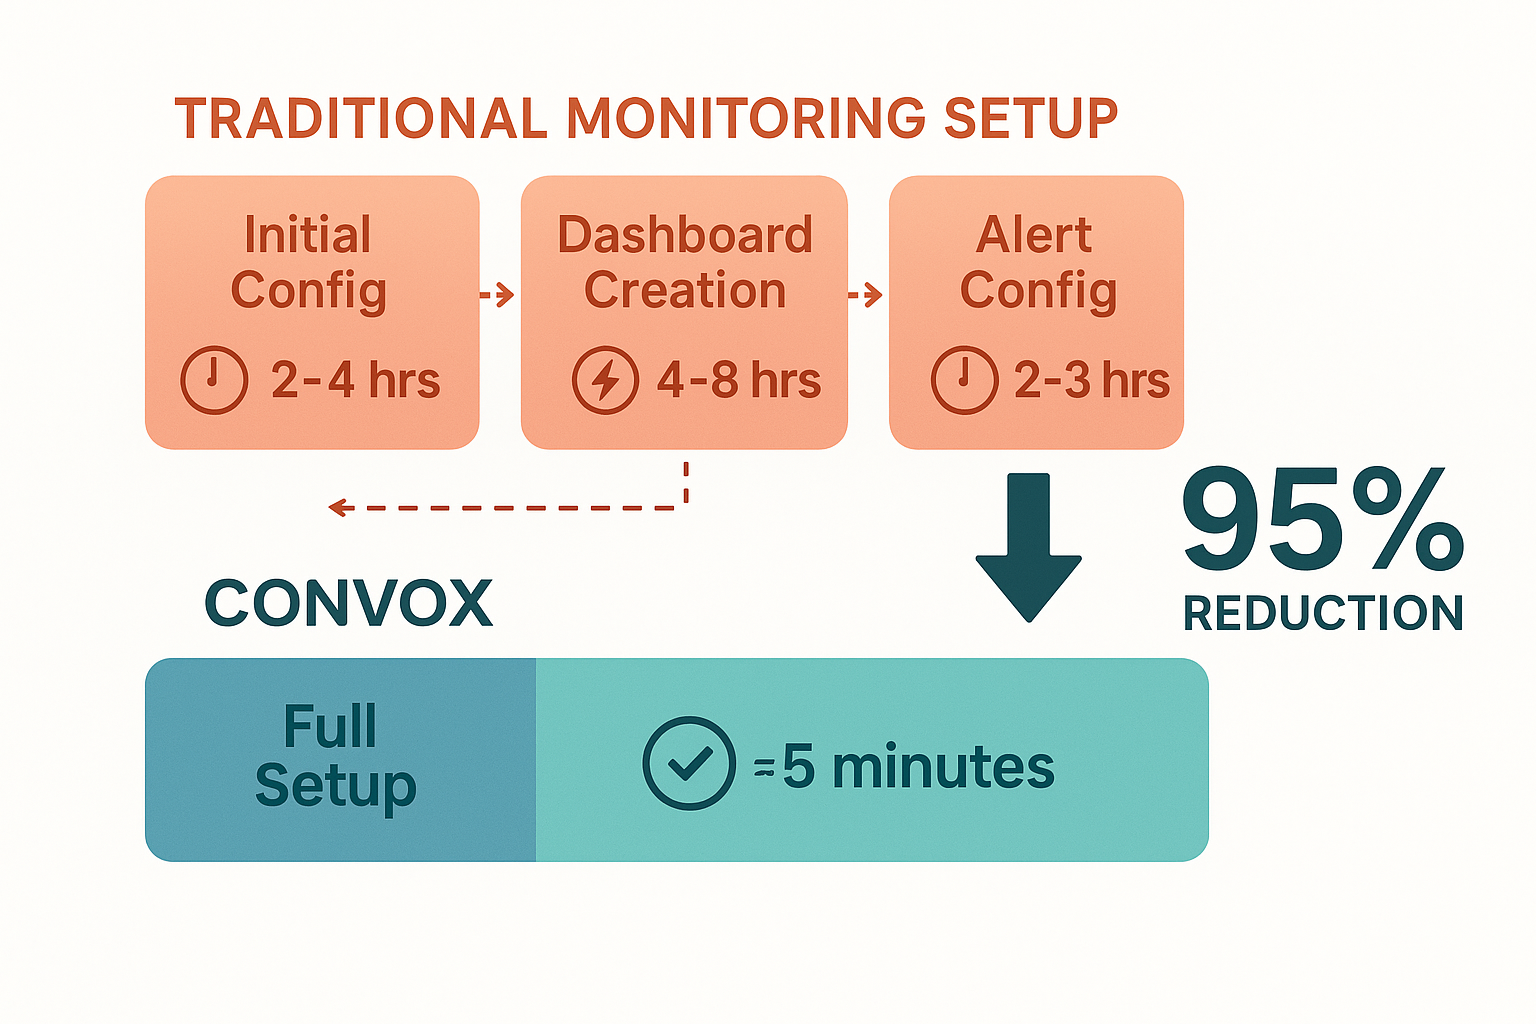
Datadog Setup:
- Initial configuration: 2-4 hours
- Dashboard creation: 4-8 hours per dashboard
- Alert configuration: 2-3 hours per alert rule
- Total: 15-30 hours for basic monitoring
Prometheus + Grafana Setup:
- Installation and configuration: 4-8 hours
- Exporter setup: 2-4 hours
- Dashboard creation: 6-12 hours
- Alert configuration: 4-6 hours
- Total: 16-30 hours for basic monitoring
Convox Metrics Setup
Complete Setup Time: 5 minutes
- Enable Metrics Agent: 1 minute
- Agent installation: 2 minutes (automatic)
- Default dashboards: Instant
- Basic alerting: 2 minutes
This represents a 95% reduction in setup time compared to traditional solutions.
The Intelligence Advantage
Automated Insights vs. Manual Configuration
Traditional monitoring platforms require teams to:
- Understand what metrics to collect
- Know how to query and visualize data effectively
- Manually configure alerts for known failure patterns
- Maintain and update dashboards as applications evolve
Convox Metrics leverages built-in intelligence to:
- Automatically collect relevant metrics
- Provide pre-configured visualizations for common use cases
- Suggest alert thresholds based on application patterns
- Continuously adapt to changing infrastructure
Reduced Cognitive Load
Modern observability tools should reduce complexity rather than add to it. By providing Smart Panels and Smart Queries, Convox eliminates the need for teams to become monitoring experts, allowing them to focus on what matters most: building and improving their applications.
Best Practices: Getting Started with Convox Metrics
Enabling Metrics in Your Rack
- Navigate to your rack in the Convox Console
- Click Rack Settings in the left sidebar
- Find the Dashboard Settings section
- Toggle Enable Metrics Agent to on
- Wait 2 minutes for automatic installation
Building Your First Custom Panel
- Go to V3 Dashboard in the Metrics section
- Click Create Panel
- Use Smart Queries to select your metrics
- Preview and adjust as needed
- Save your panel
Setting Up Intelligent Alerts
- Navigate to Alert Manager
- Select a panel with the metrics you want to monitor
- Configure conditions and thresholds
- Set up notification integrations (Slack, Discord)
- Test and activate
The Future of Monitoring: Simplicity at Scale
Industry Trends
The monitoring industry is moving toward AI-driven observability tools that provide deeper insights with less manual configuration. Organizations are seeking solutions that offer comprehensive observability without the complexity of traditional tools.
Convox's Approach
Our platform represents this evolution by:
- Eliminating the need for specialized monitoring expertise
- Providing instant value with zero-configuration dashboards
- Offering intelligent alerting that adapts to your applications
- Maintaining transparent, usage-based pricing
The Future of Developer-Friendly Monitoring
Monitoring shouldn't require specialized expertise or force teams to spend weeks learning complex query languages. With Convox Metrics' intelligent approach, you get enterprise-grade observability with zero-configuration simplicity.
Whether you're running a single application or managing complex microservices architectures, comprehensive monitoring becomes as simple as toggling a switch. No dashboards to build from scratch, no alert rules to fine-tune, no monitoring expertise required—just the Smart Panels and actionable insights you need to keep your applications running smoothly.
Ready to experience monitoring that just works? The future of application observability is intelligent automation, and the right monitoring platform can make all the difference in how quickly you can detect issues while saving significant time and costs.
Get Started Free with Smart Monitoring that sets up in 5 minutes, or contact our team to discuss your specific monitoring and alerting requirements.
To learn more about Convox Metrics and start your free trial, visit our documentation or contact our team.