
A developer we talked to recently almost closed the tab. They were comparing platforms on a Friday afternoon, looking for something that could grow with their app without turning into a second job. Then they saw the word "Kubernetes" in the feature list and felt their stomach drop. They had never written a Kubernetes manifest, never run kubectl, and had no interest in starting. To them, "Kubernetes" meant a six-month learning curve and a DevOps hire they could not afford.
Here is the thing that developer almost missed: yes, Convox runs your applications on Kubernetes under the hood. But you never touch it. You never write a YAML manifest for a Deployment, you never configure a HorizontalPodAutoscaler by hand, and you never open a terminal to run kubectl. The Kubernetes machinery is there doing the heavy lifting, the same robust orchestration that powers some of the largest systems in the world, but the interface you actually use feels less like operating a cluster and more like adjusting a couple of numbers.
This post is about exactly that: scaling without the Kubernetes learning curve. We will move from manual scaling with a single command, to declarative scale config in convox.yml, to hands-off autoscaling, to observing the results. None of it requires cluster knowledge, a kubeconfig, or a single kubectl command.
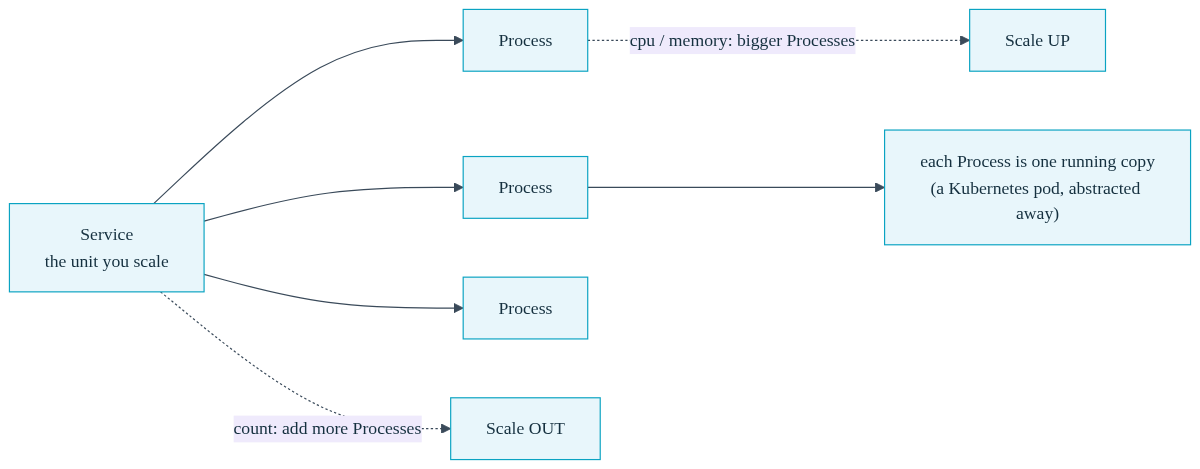
Scaling on Convox comes down to two questions: how many copies of a service should be running, and how much CPU and memory should each copy get? You set a count and a size, and Convox handles the rest. (If you have used a hosted platform like Heroku or Render, this is the same idea as choosing a count and a size there, but you do not need that background, the model stands on its own.)
A Convox Service is the thing you scale. Each running copy of that service is a Process. When you want more capacity, you run more Processes. When each Process needs more headroom, you give it more CPU and memory. That is the entire model. The fact that a Process is technically a Kubernetes pod is an implementation detail you are free to ignore.
Let's see how little you actually have to do compared to running things yourself.
| Task | Doing It Yourself on Kubernetes | Convox |
|---|---|---|
| Run 3 copies of a service | Edit a Deployment manifest, set replicas: 3, apply with kubectl |
convox scale web --count 3 |
| Set CPU and memory per copy | Write resource requests and limits blocks in YAML, reapply | --cpu 256 --memory 512 |
| Autoscale on CPU | Author a HorizontalPodAutoscaler resource, wire up a metrics server | A few lines under scale.autoscale in convox.yml |
| Check what is running | kubectl get pods, decode statuses, cross-reference namespaces | convox ps |
The fastest way to scale on Convox is the convox scale command. It is two numbers, how many copies and how big, on a single line. Say your web service is getting more traffic than one Process can handle. You want three copies, each with a quarter CPU and half a gigabyte of memory:
$ convox scale web --count 3 --cpu 256 --memory 512
Scaling web...
OK
That is the whole operation. The --count flag is the number of copies. The --cpu flag is in millicores, where 1000 equals one full CPU, so 256 is roughly a quarter of a core. The --memory flag is in megabytes. Convox starts the new Processes, performs the rollout safely, and routes traffic to them once they are healthy. You did not edit a manifest, you did not run kubectl apply, and you did not need to know what a ReplicaSet is.
You can scale just the count when you only need more copies of the same size:
$ convox scale web --count 5
Scaling web...
OK
This is the move you make right before a product launch, a marketing push, or a known traffic event. Scale up, ride out the spike, scale back down. The full set of options lives in the scale command reference. The mental overhead is just two numbers, and the Kubernetes orchestration that makes the rollout zero-downtime happens entirely behind the scenes.
Running a command is great for quick adjustments, but for the baseline scale of your application you want it written down, reviewed, and tracked. On Convox, scale is part of your convox.yml manifest, which means it lives in your repository alongside your code. No separate dashboard state, no clicking through a UI, no drift between what is deployed and what your team thinks is deployed.
Here is a service with its scale defined declaratively:
services:
  web:
    build: .
    port: 3000
    scale:
      count: 3
      cpu: 256
      memory: 512
  worker:
    build: .
    command: bin/worker
    scale:
      count: 2
      cpu: 128
      memory: 256
This says the web service runs three Processes at a quarter CPU and half a gig each, and the worker service runs two Processes at a smaller size. Anyone on your team can open the file and know exactly how the application is sized. When you change those numbers in a pull request, the change is reviewed and applied on your next deploy. This is the same per-service CPU and memory control described in the scaling documentation.
One important detail worth knowing up front. The static scale.count value in convox.yml is applied on the first deploy of a service. After that, changing the running count is done with convox scale or through autoscaling, so that a routine deploy does not accidentally reset a count you adjusted during a traffic event. The CPU and memory values in the manifest remain the source of truth for sizing. This is a deliberate design choice: it keeps your deploys from stomping on a scale-up you made an hour ago.
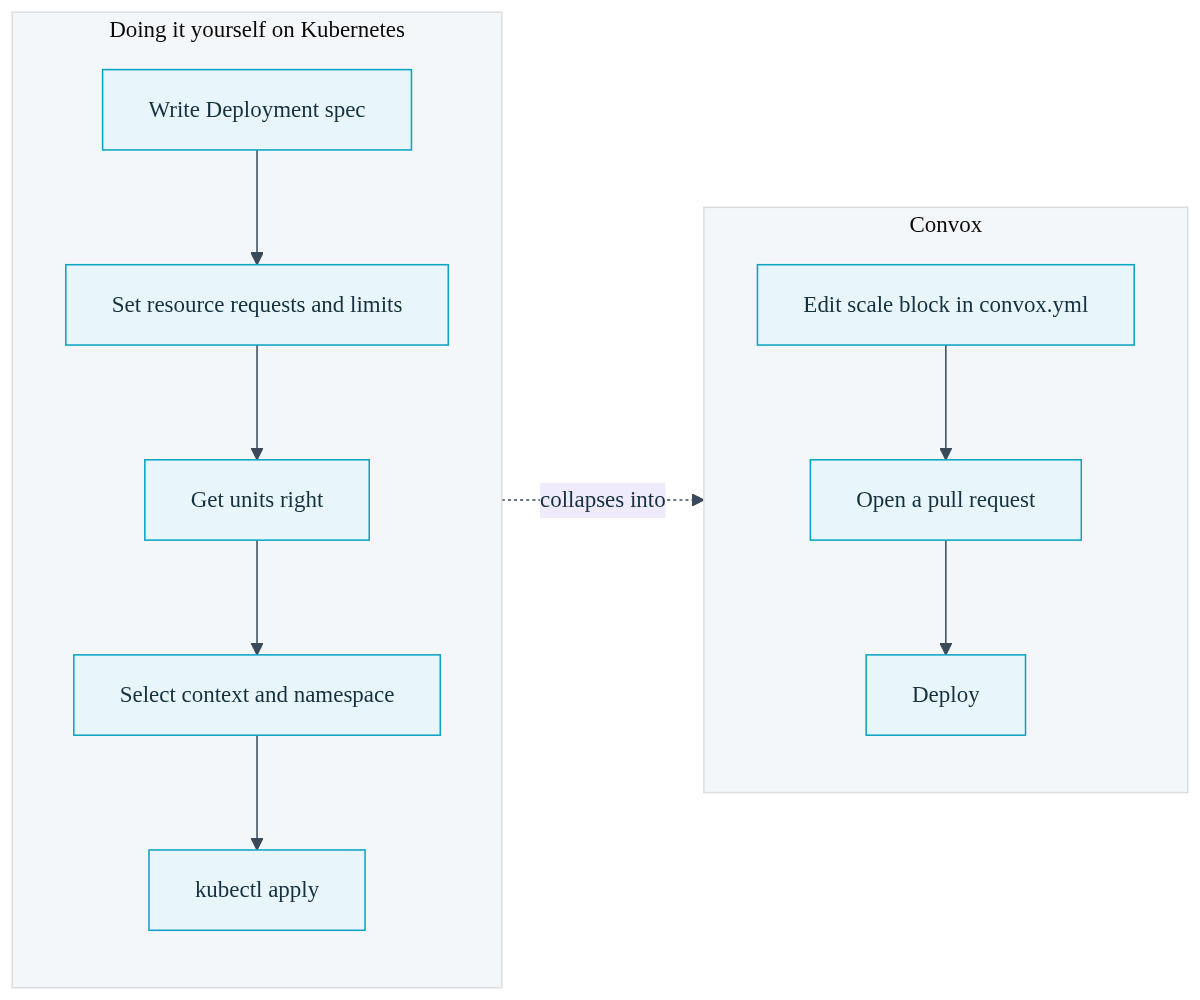
Compare this to the alternative. Running Kubernetes directly, sizing a service means writing resource requests and limits across a Deployment spec, getting the units right, and applying the manifest with the correct context and namespace selected. Convox collapses all of that into a handful of readable lines that a developer who has never seen a Kubernetes manifest can understand at a glance.
Manual scaling and declarative config are both still you deciding the number. The next step up is letting the platform decide for you. This is the part that genuinely beats adjusting the numbers by hand, because nobody gets paged at 2am when traffic spikes.
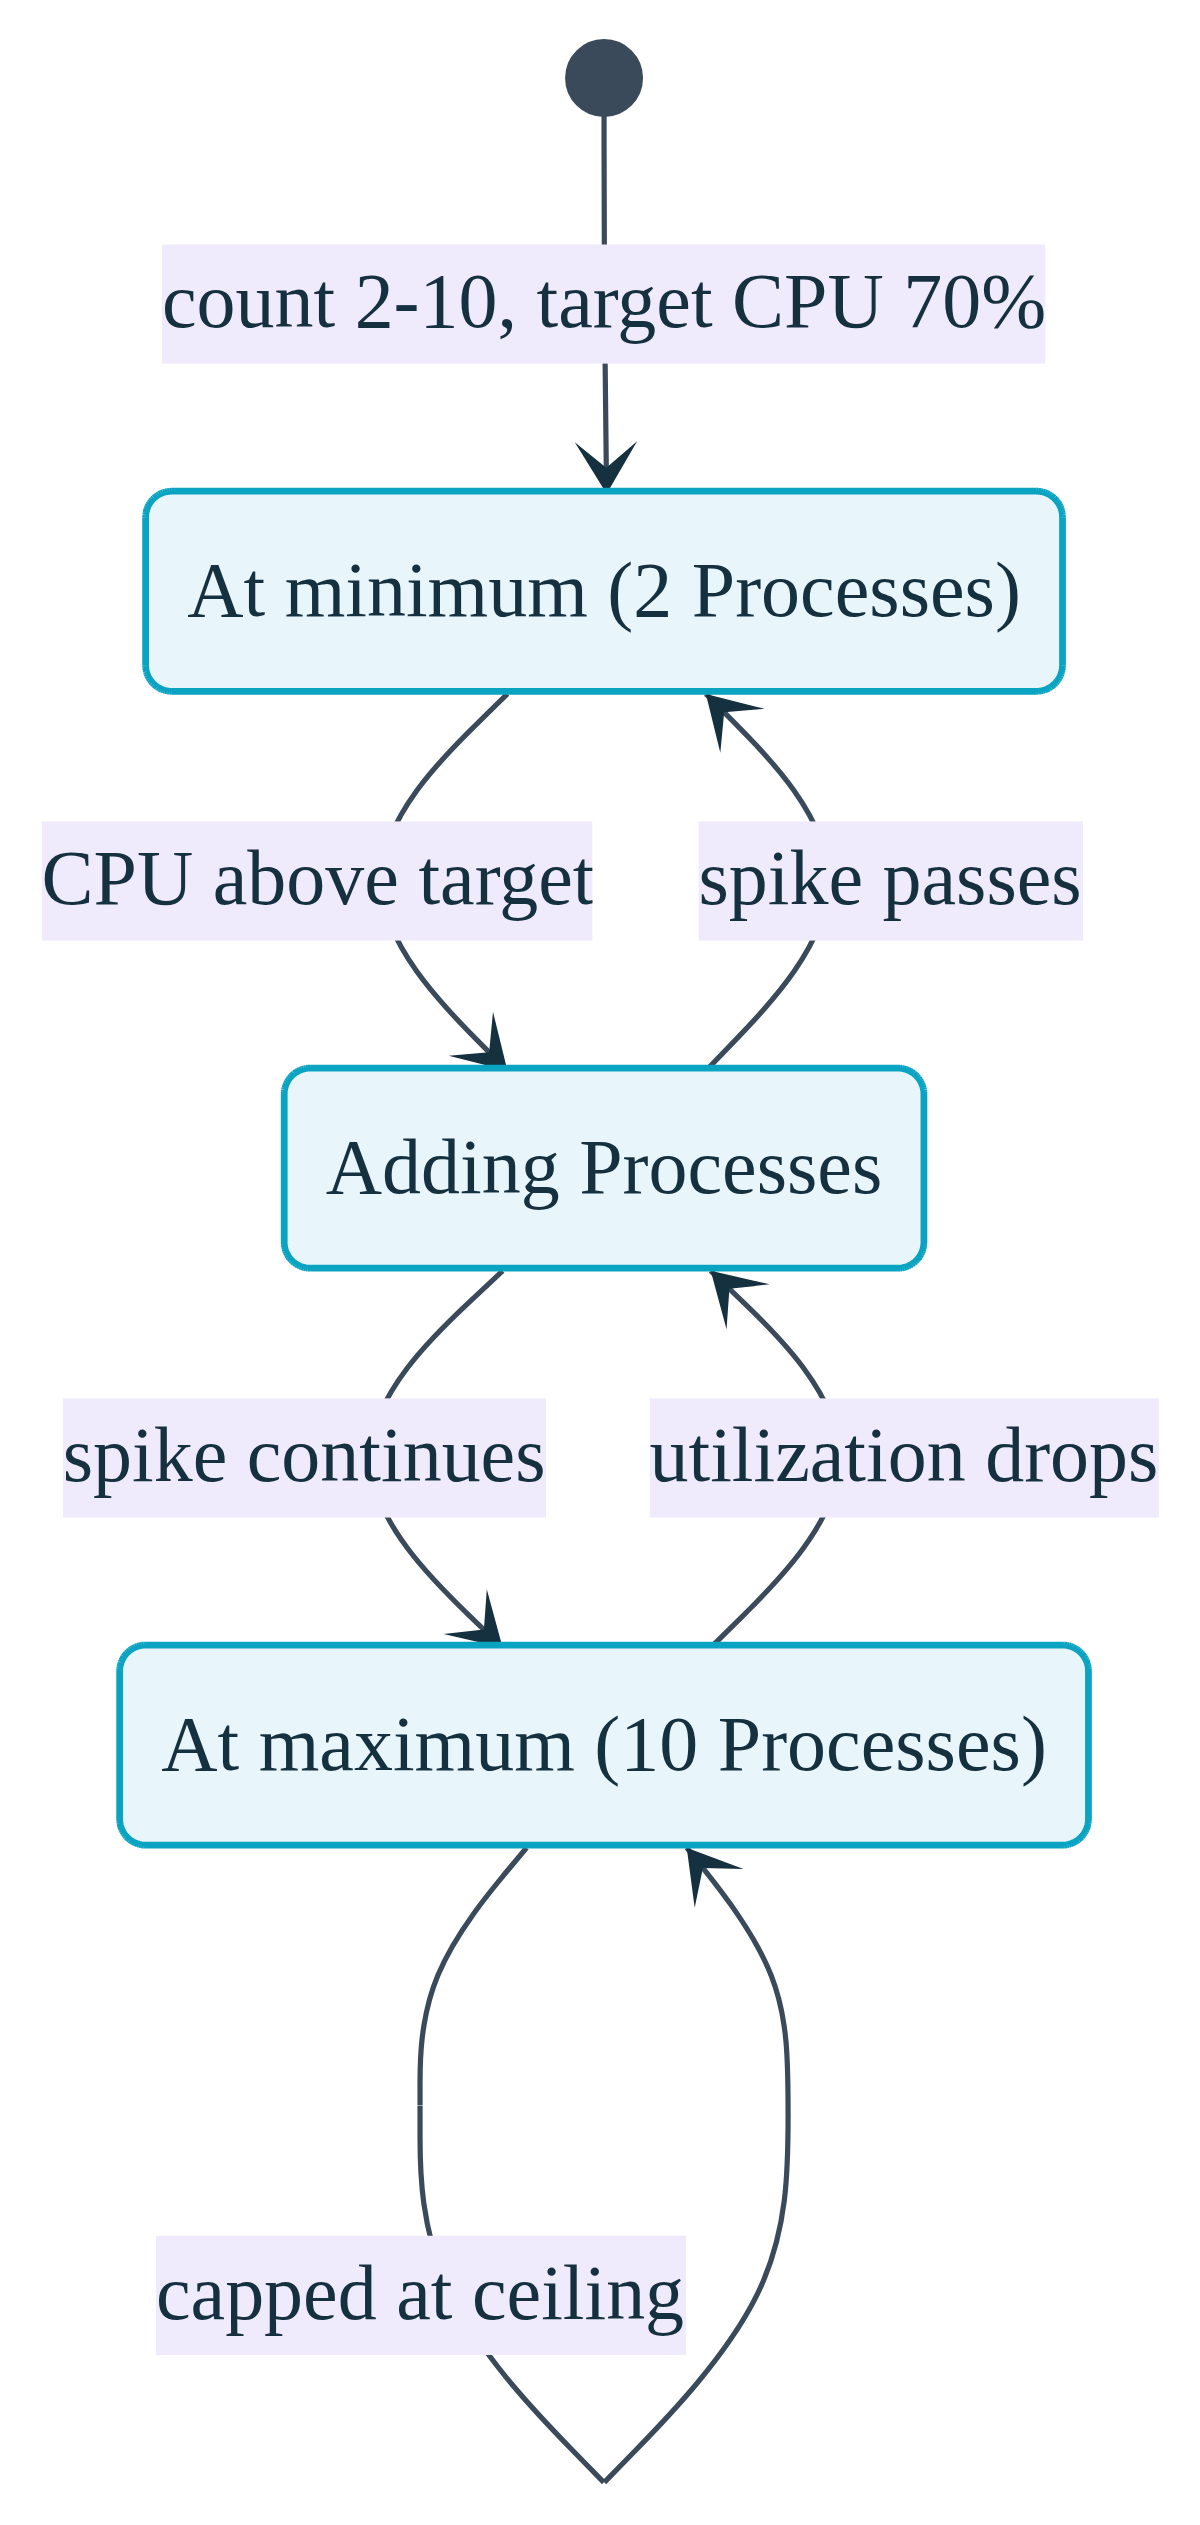
With scale.autoscale in your convox.yml, you set a floor, a ceiling, and a target. Convox watches the metric and adds or removes Processes to keep the metric near your target, staying within the bounds you set:
services:
  web:
    build: .
    port: 3000
    scale:
      count: 2-10
      cpu: 256
      memory: 512
      targets:
        cpu: 70
        memory: 80
The count: 2-10 line sets a minimum of two Processes and a maximum of ten. The targets block tells Convox to keep average CPU utilization around 70 percent and memory around 80 percent. When a traffic spike pushes CPU above the target, Convox adds Processes up to the maximum. When the spike passes and utilization drops, it scales back down toward the minimum. You wrote a few lines once, committed them, and now traffic spikes are handled automatically.
CPU and memory targets work on every Convox Rack with no extra setup. There is no metrics server to install, no autoscaler resource to author, and no controller to babysit. If you have ever looked at a HorizontalPodAutoscaler manifest and the metrics pipeline it depends on, you know what you are being spared here.
For teams that grow into more advanced needs, Convox also supports event-driven autoscaling on signals like queue depth, covered in the autoscaling documentation. But you do not need any of that to start. CPU and memory targets cover the overwhelming majority of web applications, and they are the natural first step for a team that just wants scaling to handle itself.
Scaling is only half the story. You also want to see what is running and confirm everything is healthy. On a raw Kubernetes cluster, that means kubectl get pods, decoding pod statuses, and remembering which namespace your app lives in. On Convox, it means one command:
$ convox ps
ID                    SERVICE  STATUS   RELEASE     STARTED        COMMAND
web-6844dc6f45-9wdss  web      running  RABCDEFGHI  2 minutes ago
web-6844dc6f45-mj9mp  web      running  RABCDEFGHI  2 minutes ago
web-6844dc6f45-kp4xq  web      running  RABCDEFGHI  2 minutes ago
Three Processes for the web service, all running, all on the same release. That is your running count, right there in the terminal, readable without any Kubernetes vocabulary. The ps command reference covers the full output and its options.
When you want to see what those Processes are actually doing, convox logs streams aggregated output from every Process across the service, each line tagged with its source so you can trace activity:
$ convox logs --service web --since 5m
2026-01-15T14:30:00Z service/web/web-6844dc6f45-9wdss GET / 200
2026-01-15T14:30:01Z service/web/web-6844dc6f45-mj9mp GET /api/users 200
2026-01-15T14:30:02Z service/web/web-6844dc6f45-kp4xq GET /health 200
You can filter by service, by content, or by time window, all documented in the logging documentation. The point is that everyday operations, checking what is running and watching the logs, never require a kubeconfig, never require cluster credentials, and never require you to learn how Kubernetes labels its resources. If a deploy ever does go sideways, convox deploy-debug inspects the underlying pods for you and returns plain-language hints, again without you ever touching kubectl.
Convox is built on Kubernetes, and that is a feature, not a warning label. Kubernetes is the proven orchestration layer that handles zero-downtime rollouts, self-healing, and horizontal scaling reliably at any size. What Convox does is take that power and put a simple, familiar interface in front of it, so the complexity stays in the platform and out of your day.
Scaling services with no kubectl is the everyday reality on Convox. You scale manually with convox scale web --count 3 --cpu 256 --memory 512 when you want to set the numbers yourself. You commit scale.count, CPU, and memory to convox.yml when you want your baseline sizing in version control. You add a scale.autoscale block when you want traffic spikes handled without anyone getting paged. And you watch it all with convox ps and convox logs. Horizontal scaling on a PaaS does not get more approachable than this, and you never had to write a Kubernetes manifest to get it.
The developer who almost closed the tab? They tried it, scaled their first service in one command, and never looked back. The word Kubernetes turned out to be the engine, not the steering wheel.
Ready to scale your first service in one command? The Getting Started Guide walks through installation and your first deployment, and the scaling documentation covers every option in detail.
Create a free account and deploy your first app, then run a single convox scale command to see how little there is to it. Questions about migrating a larger application? Reach out to our team.